- Discover
-
Expertise
-
Alternative Delivery
- I-275 at I-4 Downtown Tampa Interchange Design-Build
- Wekiva Parkway Section 8 Interchange
- US 17/92 Interchange at SR 436
- SR 9B Extension from I-95 to US 1
- A. Max Brewer Bridge Replacement
- I-95 Widening from the Indian River/Brevard County Line to Malabar Road
- SR 528 (Beachline Expressway) at Innovation Way Interchange
- SR 570 Polk Parkway Widening from I-4 to Pace Road
- I-95 Express Lanes and Ramp Signals – Phase 3A-1
- Pollard Road Extension over Peace Creek
- I-485 Widening from I-77 to Rea Road
- Monroe Bypass/Connector Design-Build
- Construction Services
- Ecological Services
-
Federal Services
- Range of the Future Study
- US Coast Guard Air Station (Clearwater)
- Ascension Island Fire Station Renovation
- Patrick Space Force Base Water Lines Repair
- Patrick Space Force Base Living Shoreline Restoration
- P-505 Electrical Hardening and Black Start CHP at Marine Corps Air Station Beaufort
- Naval Station at Guantanamo Bay Survey Services
- Repair Phillips Parkway and Speed Limit Study
- Ascension Island Auxiliary Airfield Surveying and Mapping Services
-
Geographic Information Systems (GIS)
- Thermal Design/Comprehensive Campus LiDAR Collection
- Greater Orlando Aviation Authority (GOAA) Strategic Commerical Land Development Program
- University of Florida Sanitary Sewer GIS Mapping
- Ascension Island Auxiliary Airfield GIS Integration
- Santa Rosa County School District's School Transportation & Capacity GIS Analysis
- Gainesville Community Redevelopment Agency Socioeconomic Analysis and Site Suitability Report
- Real Estate Site Suitability and Development Analysis
- SR 836 (Dolphin Expressway) GIS Asset Inventory of Pre-Post Construction
- Alachua County Public Schools GIS and School Planning Professional Services
- Patrick Space Force Base Living Shoreline Restoration GIS Analysis
- Florida Army National Guard Readiness Center GIS Inventory & Integration
- Comprehensive Transit Study Puerto Rico GIS Analysis
- Land Development
- Structural Engineering
-
Subsurface Utility Engineering (SUE)
- Thermal Design/Comprehensive Campus LiDAR Collection
- P-505 Electrical Hardening and Black Start CHP at Marine Corps Air Station Beaufort
- Resurface & Safety Improvements Turnpike Mainline
- University of Florida Rabon Utility Mapping
- FP&L Subsurface Utility Engineering Continuing On-Call Contract
- Lockheed Martin Subsurface Utility Engineering Services
- Palm Coast Parkway Subsurface Utility Engineering Services
- Surveying & Mapping/Geospatial
-
Traffic Impact Analysis
- 505 West Chapel Hill Street
- 5th Street Station
- Beale Farm Industrial Park
- Blue Mountain Mist Resort
- The Villages at McCullers Walk
- Fredericksburg National Baseball Stadium
- Hendrick Southpoint Auto Mall
- Apex Friendship Elementary School
- Whole Foods Center
- Barclay West
- Grove 98
- Pullen Drive Extension/Catholic Diocese
- Trails/Parks & Recreation Facilities
- Transportation
-
Utilities Engineering
- Ascension Island Fire Station Renovation
- M-1 Canal Water Main Extension
- 5th Street Bridge Utility Replacement
- Captain’s Cove Wastewater Plant Revisions & Permit Renewal
- City of Fort Myers Downtown Utility & Streetscape Improvement
- Florida Caverns State Park Lift Station Rehab
- Tween Waters Inn Wastewater Plant Permit Renewal
- City of Fort Myers Wastewater Capacity Studies
- Patrick Space Force Base Water Lines Repair
- Big Lagoon Boat Ramp Wastewater System
- St. Joseph State Park Septic Tank Replacement
- WildBlue Development Wastewater Modeling
- A-1 Gator Wastewater Capacity Increase
- Water Resources/Stormwater Management
-
Alternative Delivery
- Careers
- Insights
- Connect
- Powered By Trilon

GIS: The Unsung Hero Behind Smarter Communities
July 15th, 2025


Geographic Information System (GIS) may not be a household term, but its impact is everywhere. Whether you're checking traffic, finding the fastest route, or locating a nearby restaurant, GIS is quietly working in the background.
GIS is a smart technology that combines maps, data, and tools, such as apps, dashboards, and field forms to help people make better decisions. DRMP’s GIS experts are using it to help schools plan for future student growth, streamline infrastructure improvements, and optimize resources to save clients time and money.
DRMP’s GIS team, for example, developed a custom Growth Management App for Hillsborough County Public Schools in Tampa, Fla., that helps the school district track new housing developments and estimate student enrollment. The team has also developed a custom mobile field form to streamline field data collection for a major statewide lighting upgrade on Florida’s Turnpike. The tool helped crews efficiently document critical asset information, accelerating mapping efforts and improving project outcomes.
Whether it’s planning for growth, improving infrastructure, or responding to change, GIS tools help make sense of complex information, turning data into smarter decisions.
DRMP’s GIS experts, Mark Brown, GISP, and Ravneet Kathuria, explore how GIS is transforming the systems and services we depend on daily.
What are some examples of how GIS is used by people in their everday lives?
GIS shows up in more places than you might think. Here are a few everyday examples:
Emergency Services
Police, firefighters, and paramedics use GIS to quickly locate incidents and deploy resources efficiently.
Navigation Apps (Google Maps, Uber, DoorDash)
When you get directions on your phone, GIS is working behind the scenes to find the fastest route, avoid traffic, and show nearby places. This can also be used in food delivery apps.
Weather Forecasting
Meteorologists use GIS to map storms, predict weather patterns, and warn people about severe weather in specific areas.
Real Estate
Websites, such as Zillow, use GIS to show you homes for sale along with information about the neighborhood, schools, and local amenities.
How does DRMP's GIS team assist clients and DRMP's other disciplines?
The GIS team leads a diverse range of projects, including independently secured contracts for specialized GIS services. In addition to managing our own contracts, the GIS team frequently collaborates with other disciplines across DRMP, contributing GIS expertise and support for a variety of job pursuits and ongoing projects.
We help our clients by providing custom-made mapping and location-based tools. This includes tools like ready-to-use maps, interactive story maps, smart forms for collecting data in the field, building special apps, cleaning up map data, and more. All of these are made to fit exactly what each client needs, so they can better see, manage, and use their location information.
What tools has GIS created to support DRMP's clients and our staff?
We created a Growth Management App to help Hillsborough County Public Schools in Tampa, Fla., keep track of new housing developments and how many students they might bring. The app also helps the schools estimate student numbers, assign students to schools, and manage all this information in one easy-to-use place, so they don’t have to use complicated spreadsheets anymore.
Additionally, we’ve made it easier and faster for DRMP’s Project Development and Environmental Services (PDES) team to collect and report noise data in the field. Instead of writing information down by hand, they now use digital smart forms on a tablet or phone. The data they collect is instantly sent to dynamic templates that create reports and visuals on the spot, saving time and improving accuracy. This automation reduces the risk of manual errors and removes the need for direct input into Word documents or PDF reports during generation.
Without GIS, many of DRMP’s projects would be significantly slower, more expensive, and less accurate. Tasks like environmental assessments, utility mapping, supporting higher education platforms, federal project planning, and field collection would rely heavily on manual methods, such as paper maps, spreadsheets, and disconnected data sources.
Can you give an example of a project where GIS saved time or money?
One example is our lighting conversion project for Florida’s Turnpike Enterprise (FTE) in which we are converting High-Pressure Sodium (HPS) lighting to Light-Emitting Diode (LED) lighting along this major tolled highway. We leveraged Mobile LiDAR to accurately map the locations of lighting poles. While this gave us precise spatial data, we still needed detailed attribute information. To streamline this, we developed a Field Maps smart form that allowed field crews to collect critical details such as pole numbers, visible damage, and mount types. This significantly saved both time and money by reducing manual mapping efforts and enabling faster, more informed maintenance decisions. With the data integrated into an ArcGIS instant app, users can now view each pole’s exact location, current condition, and even a photo, making planning and repair work more efficient than ever.
What's the most surprising or unexpected way you've seen GIS used on a project?
One surprising application we’ve seen was using 2D tax parcel data extruded into 3D to visualize property values across a city. Each parcel was represented as a 3D block, with the height corresponding to its assessed value. This created a kind of “value skyline,” revealing economic patterns and disparities that aren’t obvious on a flat map. It was a powerful and unexpected way to communicate data, helping city planners, assessors, and even the public easily identify high-value areas, spot anomalies, and make more informed decisions about zoning, taxation, and development. We also incorporated this idea into one of our projects for the City of Maitland.
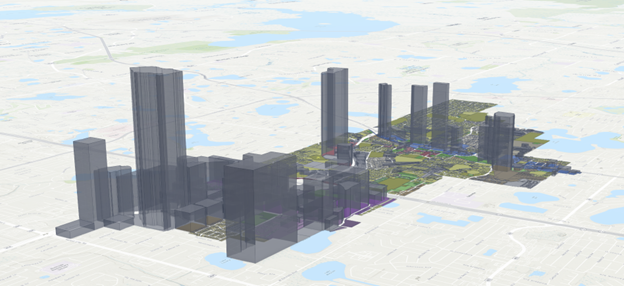
3D BIM visualization for the City of Maitland, Fla., illustrating average tax value per parcel by zoning, making complex tax data easy to understand at a glance.
How does GIS help make better decisions in planning and infrastructure projects?
GIS plays a key role in planning and infrastructure projects by providing spatial insights that lead to more informed decision-making. It allows planners and engineers to analyze location-based data for tasks such as site selection, traffic flow analysis, and environmental impact assessments. By visualizing factors such as land use, population density, natural features, and existing infrastructure, GIS helps identify optimal project locations, predict potential challenges, and minimize negative environmental effects. This data-driven approach improves efficiency, reduces costs, and supports sustainable development strategies.
What's the difference between GIS and GPS, and how do they work together?
GIS (Geographic Information System) and GPS (Global Positioning System) are related but serve different purposes.
GIS is a system for capturing, storing, analyzing, and visualizing spatial data. It helps users make sense of geographic patterns and relationships by layering different types of data (e.g., roads, land use, elevation) onto maps for analysis and decision-making.
GPS is a satellite-based navigation system that provides real-time location data (latitude, longitude, and elevation) anywhere on Earth using signals from satellites.
How they work together:
GPS provides accurate location data, which can be collected in the field using mobile devices. This data is then fed into a GIS, where it can be analyzed, visualized, and combined with other spatial layers. For example, a utility worker can use GPS to locate a water valve and then input that data into a GIS to map infrastructure, monitor maintenance, or plan future upgrades.
What types of data do GIS professionals work with, and where does it come from?
GIS professionals use data from satellites, unmanned aerial vehicles (UAVs), LiDAR, surveys, sensors, censuses, and existing GIS databases. These sources provide spatial, demographic, and environmental information used for mapping, analysis, and decision-making.
How does GIS help tell a story or communicate complex information to non-technical audiences?
GIS is a powerful storytelling tool because it transforms complex data into clear, visual narratives that anyone can understand. Through interactive maps, dashboards, and tools like heat maps or StoryMaps, GIS can highlight trends, patterns, and relationships in a way that’s intuitive and engaging. For example, a heat map can instantly show areas of high traffic congestion or flood risk, helping stakeholders grasp issues immediately. By layering different types of data, such as demographics, infrastructure, or environmental conditions, GIS allows clients and the public to explore "what if" scenarios and make informed decisions without needing a technical background. It bridges the gap between data and understanding.
How is GIS evolving with new technologies, such as AI, unmanned aerial vehicles (UAVs), or 3D modeling?
GIS is rapidly evolving thanks to advancements in technologies like AI, UAVs, and 3D modeling. AI is transforming how we analyze spatial data by automating pattern recognition, predictive modeling, and anomaly detection, saving time and uncovering insights that might be missed manually. UAVs are revolutionizing data collection, offering high-resolution aerial imagery and real-time updates for mapping, inspections, and disaster response in areas that are hard to reach. Meanwhile, 3D modeling enhances traditional 2D maps by adding depth and realism, allowing for better visualization of buildings, terrain, and infrastructure. Together, these technologies are making GIS more intelligent, interactive, and indispensable in fields ranging from urban planning to environmental monitoring. DRMP’s GIS Department is looking to explore these technologies and find ways to use them to support our clients.

Mark Brown, GISP, serves as a GIS Project Manager for DRMP's Surveying and Mapping/Geospatial Division.

Ravneet Kathuria serves as a GIS Analyst for DRMP's Surveying and Mapping/Geospatial Division.
Related Articles
 Jul21Wekiva Parkway Section 8 Interchange Closes Gap, Improves Regional Travel The Wekiva Parkway Section 8 Interchange...See Details
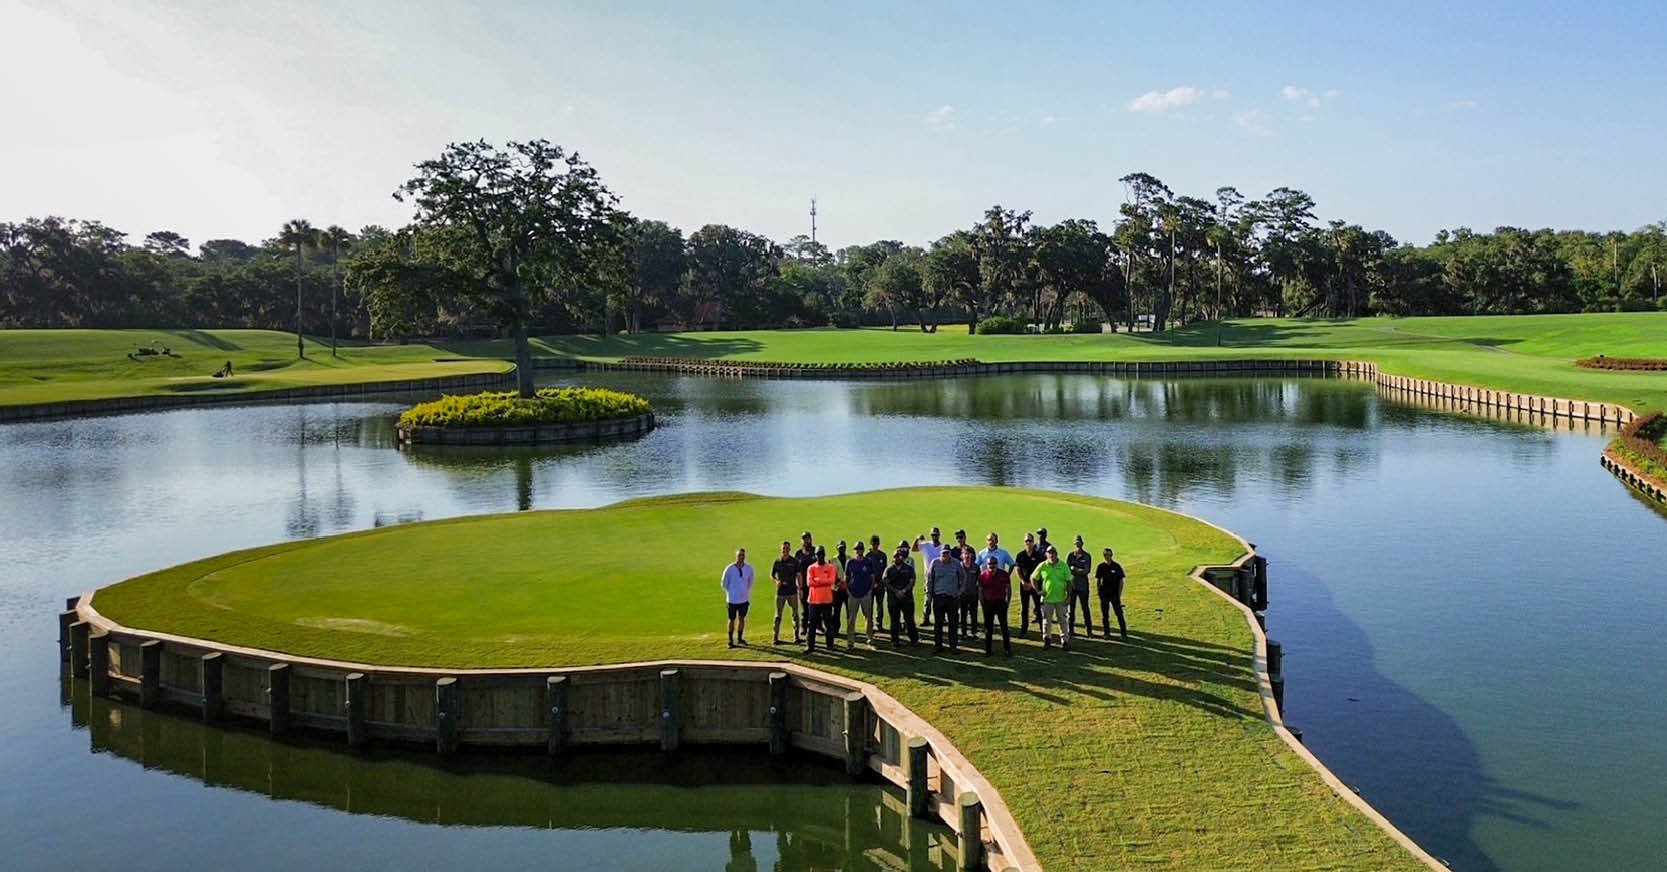 Jul14Surveying One of Golf’s Most Legendary Holes DRMP provided survey services for the re...See Details
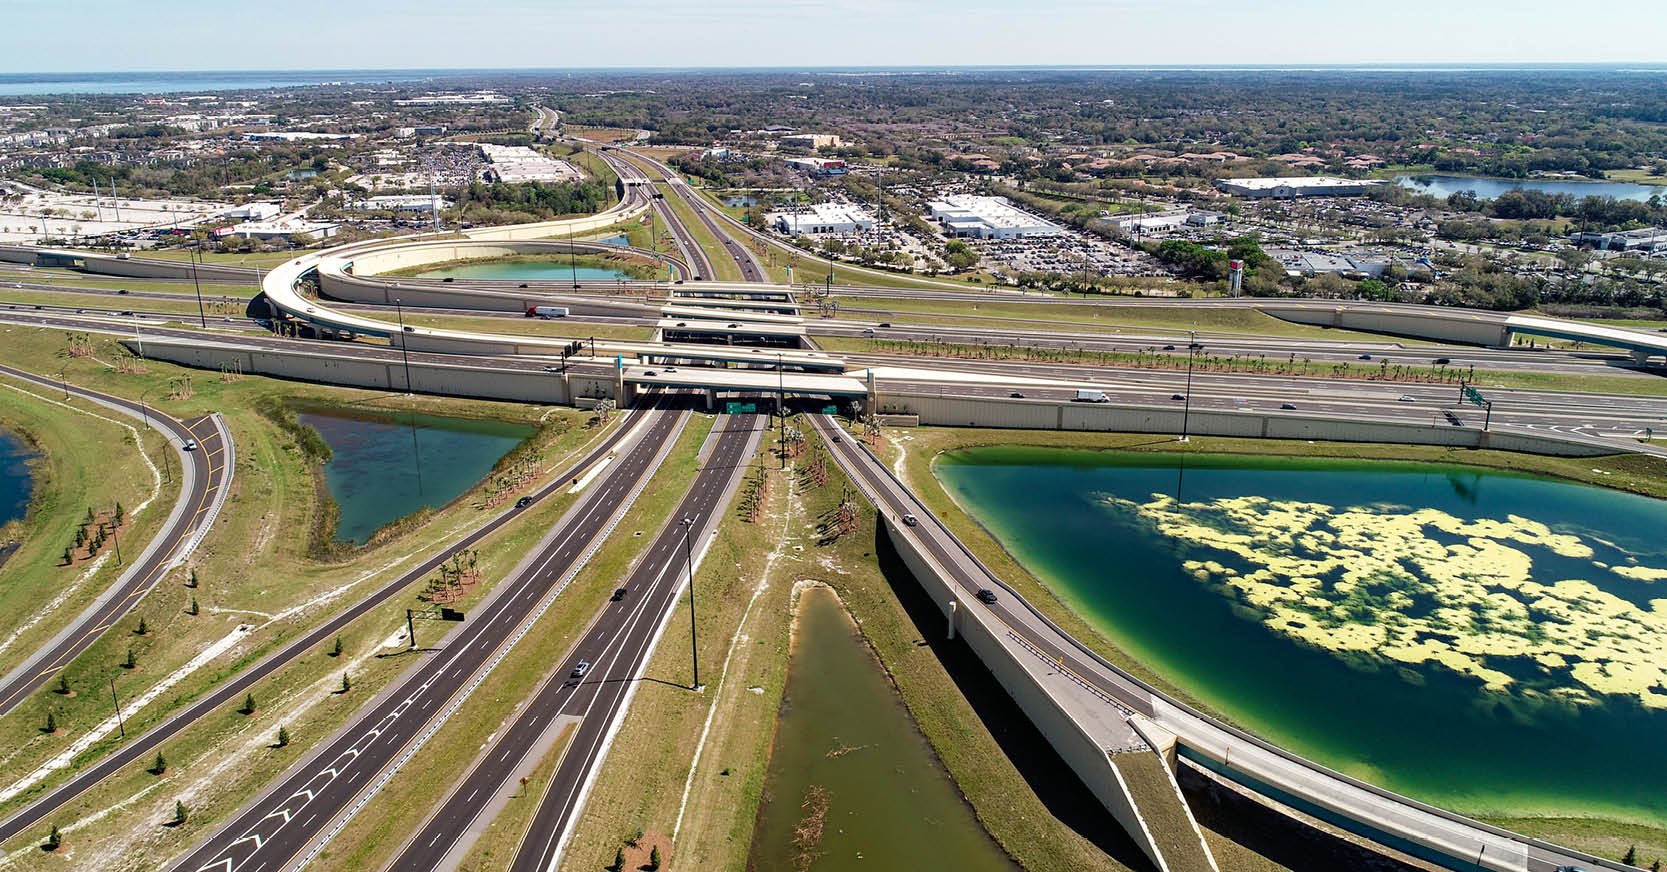
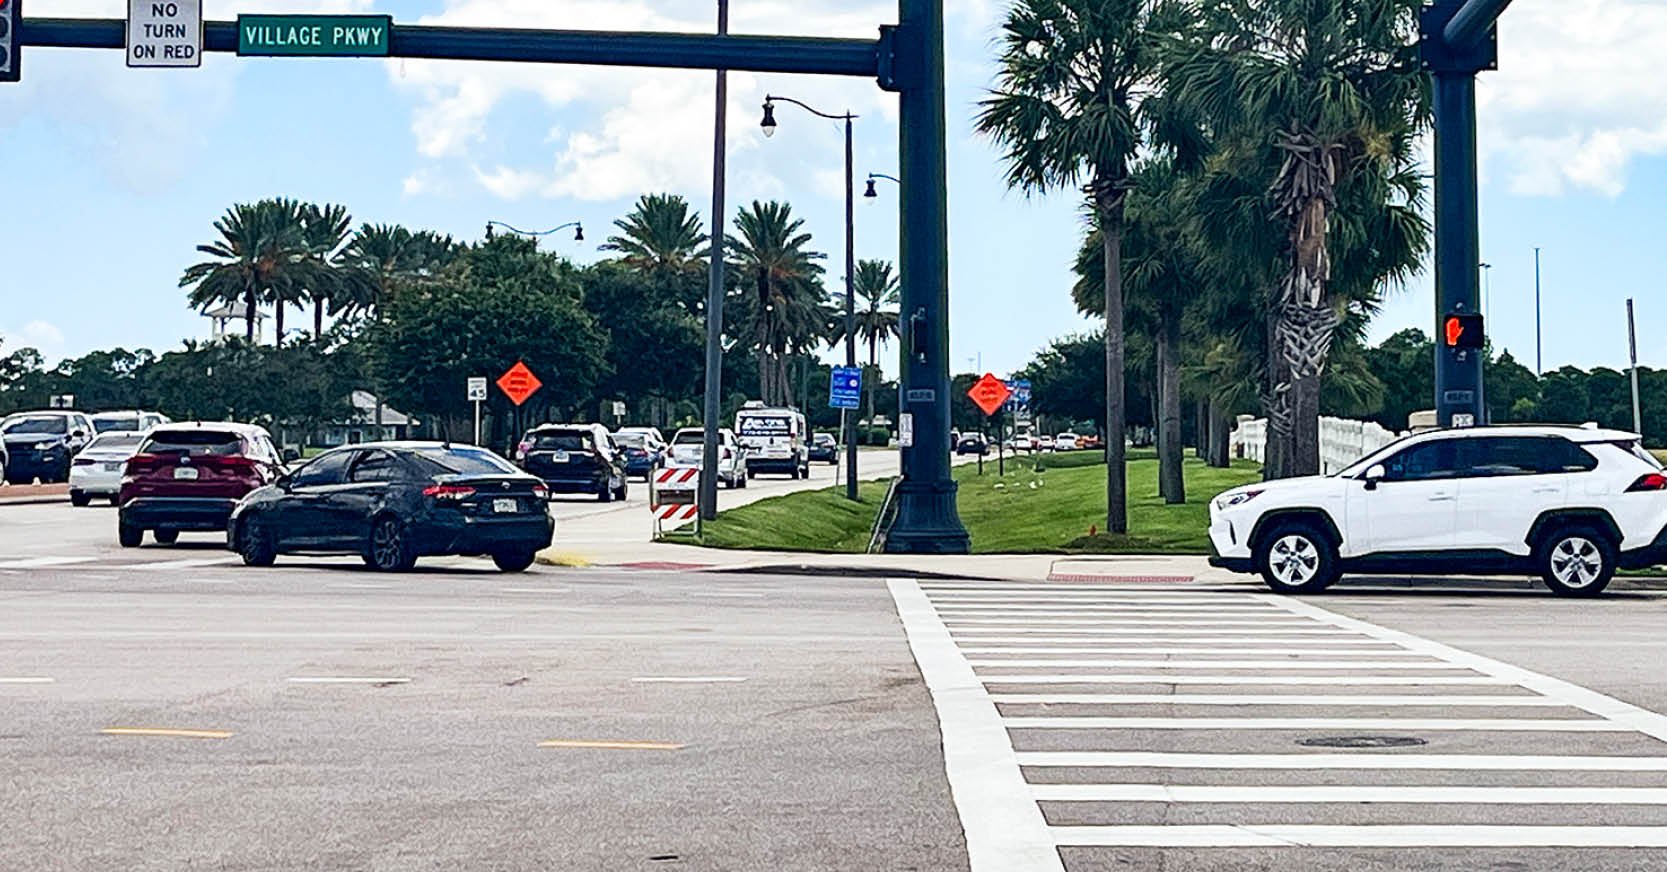 Jul7Port St. Lucie Intersection Upgrade Improves Safety at Village and Tradition ParkwaysDRMP delivered a comprehensive redesign ...See Details
 Jun25What Does Safety Look Like at DRMP Through a Safety Leader’s Eyes?Creating a safe workplace requires atten...See Details

Categories
- All
- Alternative Delivery
- Civil Services
- Construction Services
- Disaster Resilience and Sustainability
- DRMPCares
- Ecological Services
- Electrical Engineering
- eWIRE
- Federal Services
- Geographic Information Systems
- Hurricane
- Land Development
- Learning & Development
- NEPA
- Project Development & Environment
- Structural Engineering
- Subsurface Utility Engineering
- Surveying & Mapping
- Traffic Impact Analysis
- Transportation
- Transportation Planning/Project Development
- Utilities Engineering
- Water Resources/Stormwater Management
Contributors
- Michael K. Albano, PE
- Bruno J. Arriola, PE, ENV SP
- Alia Awwad, PE
- Brent Bass, PE, PSM
- Cody Bayer, PE
- Maria Bazemore, PWS, AICP
- Paul Benvie, PE
- Donald W. Brown, PE
- Kyle Brown, PE
- Jake Burton
- Zach J. Carnahan, PE
- David Couch
- Brian Crowl, PE
- Patrick Day, PE
- Nick DeVito, PE
- Joe Di Benedetto, PLS, LS
- Scott Garth, PE, LEED AP ND
- Ryan M. Grab, CST II
- Robyn Hartz, INCE
- Justin Hayes, EI
- Lucas S. Helms, PE
- Jim Highland, PE
- Ryan Ianacone, CST II
- Erica Jernigan, PE
- Ravneet Kathuria
- TJ Lallathin, Jr., PE, DBIA
- Jay McInnis, PE, CPM
- George McLatchey, PWS, CEP
- Ryan Mitchell, PE
- Megan E. Mott, PE
- Josh Norman
- Melissa Padilla Cintron, SIT
- Pavan Paiavula, PE
- Ryan Pellarin, PE, CCM
- AJ Perkinson, PLS
- Julian Poole, PE
- Kayla Poulos, PE
- Kim Sadowski, PE, RSP1
- John Schick, PTP
- Rachel L. Schmidt, PWS
- Logan Shappell
- Rynal Stephenson, PE
- Albert Taylor
- Deston Taylor, PE, PTOE
- Keelyn Taylor, PhD
- August Thick II, PLS
- Thomas Tracz, PSM
- Hung Tu, PE, SE
- Grady Vaughan, PE, PTOE, PTP
- Orville Williams
- Amanda E. Woods, PE


